Title
Title
Paper Information Information Journal: Journal of Earth Science Authors: Siyuan Ma a, Xiaoyi Shao a, b, Chong Xu *b, c Affiliations: a: Key Laboratory of Earthquake and Volcanic Hazards, Institute of Geology, China Earthquake Administration b: National Institute of Natural Hazards, Ministry of Emergency Management c: Key Laboratory of Compound and Chained Natural Hazards Dynamics, Ministry of Emergency Management Abstract Abstract In landslide susceptibility mapping (LSM), the reasonable selection of mapping units is very important. There are many types of units available, but which one performs better remains unclear. This study aims to quantitatively compare two commonly used units—the slope unit (SU) and the raster unit (RU)—based on landslides triggered by the 2013 Mw 5.9 earthquake in Minxian County, Gansu Province, China. Ten landslide influencing factors were considered in the analysis. For each unit type, 70% of the samples were randomly selected to train the LR model 20 times, generating 20 susceptibility maps, and the remaining 30% of the samples were used to test the accuracy of the model results. The quality of the susceptibility maps was evaluated using different indicators such as mean probability, model uncertainty, and model predictive capability. The results show that the probability distribution maps of both mapping units can basically predict the distribution of actual landslides, and the high-susceptibility areas correspond to landslide-prone areas. The AUC (area under the curve) values range from 0.8 to 0.86, indicating that the predictive capability of the two units is roughly the same. Compared with RU, SU has an advantage in reducing the model uncertainty caused by changes in the training set. We converted the RU-based evaluation results into the SU scheme, and the results show a good linear relationship between the two, which means that it is feasible to convert RU-based landslide susceptibility mapping into the SU scheme. This study shows that, compared with RU, SU cannot improve the performance and accuracy of earthquake-induced landslide susceptibility mapping.
Figures & Tables Figures & Tables Fig. 1 Shaded relief map showing the tectonic setting of the 2013 Minxian earthquake. Active fault data are from Deng (2007) Fig. 2 Geological map of the study area Fig. 3 Inventory and statistical results of landslides triggered by the 2013 Minxian earthquake. Fig. 4 Distribution maps of influencing factors in the study area. (a) Elevation; (b) Slope angle; (c) Profile curvature; (d) Topographic wetness index (TWI); (e) Distance to epicenter; (f) Distance to seismogenic fault; (g) Peak ground acceleration (PGA); (h) Distance to rivers; (i) Distance to roads. Fig. 5 Slope unit distribution map of the study area Fig. 6 Landslide area percentage (LAP) distribution and statistical results of 3,760 slope units. (a) LAP of each slope unit; (b) Relationship between LAP and slope unit area; (c) Box plot showing the area distribution of 3,760 slope units Fig. 7 Box plots of P-value distributions of 20 independent variables Fig. 8 Flowchart of landslide susceptibility mapping in this study Fig. 9 LSM results based on slope units (SU). (a) Mean probability distribution of 20 SU probability results; (b) Histogram of predicted probability classes; (c) Standard deviation (model uncertainty) distribution of 20 SU probability results; (d) Relationship between standard deviation and mean probability for each slope unit Fig. 10 LSM results based on raster units (RU). (a) Mean probability distribution of 20 RU probability results; (b) Histogram of predicted probability classes; (c) Standard deviation (model uncertainty) distribution of 20 RU probability results; (d) Relationship between standard deviation (model uncertainty) and mean probability for each RU Fig. 11 Landslide susceptibility map of RU converted to slope units (T-SU). (a) Mean probability distribution of T-SU; (b) Histogram of probability classes; (c) Standard deviation distribution of T-SU; (d) Relationship between standard deviation and mean probability for each slope unit Fig. 12 Prediction curve results of 20 LR models using two mapping units. (a) Slope units (SU); (b) Raster units (RU) Fig. 13 Relationship of predicted probability for each slope unit between SU-based and T-SU-based LSM results Conclusion Conclusion Based on landslide data from the 2013 Mw 5.9 earthquake in Minxian County, Gansu Province, China, this study conducted landslide susceptibility mapping using two units—slope units (SU) and raster units (RU)—in the study area, and compared the two results. The results show that the probability distribution maps of both mapping units can reflect the spatial distribution of actual landslides, with high-probability areas concentrated on both sides of the seismogenic fault. The AUC values indicate that both mapping units have good model predictive capability, with AUC values ranging from 0.80 to 0.86. Comparing the model uncertainty introduced by changes in the training set, the results show that in the medium probability interval (0.3–0.7), the standard deviation is relatively large, indicating that this interval is susceptible to the training set and has low reliability. In addition, the model uncertainty of RU is greater than that of SU. Converting the RU mapping results into SU results shows that the two LSM results fit well and have a good linear relationship. This indicates that it is feasible to convert RU-based landslide susceptibility mapping results into the SU scheme. References References Ma S, Shao X, Xu C. Landslide susceptibility mapping in terms of the slope-unit or raster-unit, which is better? J Earth Sci 34: 386–397[EB/OL].(2023)


Academic Achievements | Great News! Lei Bin Innovation Studio Wins Two Science and Technology Awards from the Guangdong Construction Industry Association!
下一篇Society News | Notice on the Announcement of the Award-Winning Projects of the Jiangxi Civil Engineering and Architecture Society's (First) "Science and Technology Award" and "Young Science and Technology Talent Award"

2026-09-28 1157 0

2026-09-24 10586 0

2026-09-23 10714 0
2026-09-22 10808 0

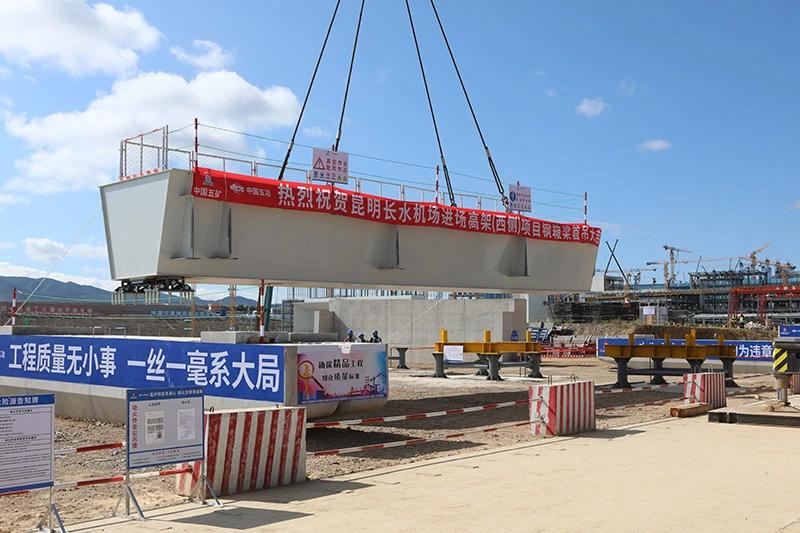
Lize City Air Terminal Underground Main Structure Nearing Completion: Maximum Transfer Walk Under 4 Minutes After Operation

Anti-seepage Curtain for Main Lock Pit of CSCEC Port Shenqiu Double-Line Lock Project Completed on Schedule

All Pile Foundations Completed on Quanzhou Baiqi Channel

Hainan Upgrades Housing and Municipal Infrastructure
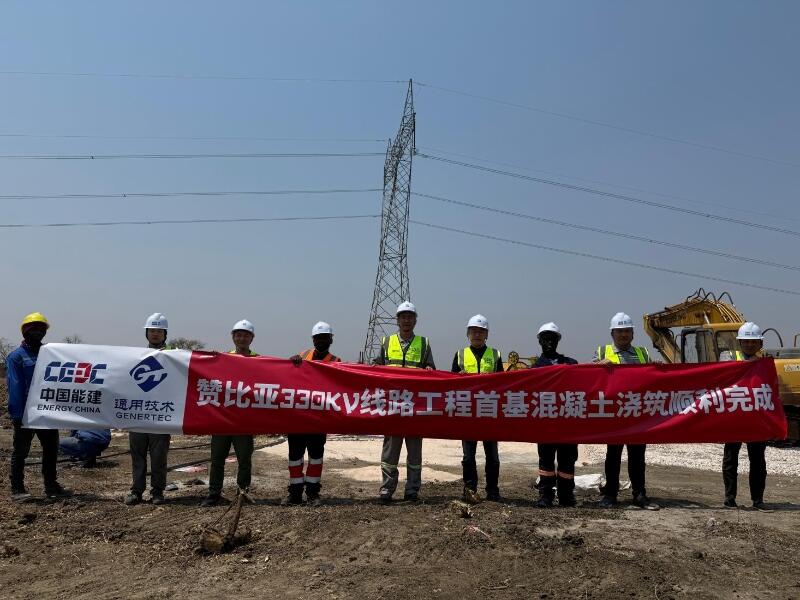
First Foundation Concrete Pour Successfully Completed for Zambia Kafue West–Muzuma 330kV Transmission Line EPC Project
Hot News

评论 (0)