
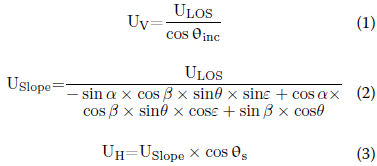
https://doi.org/10.1186/s40677-025-00331-x Abstract On May 1, 2024, a landslide occurred on an embankment slope of the Meizhou–Dabu Expressway in Guangdong Province, China, causing the road surface to collapse, resulting in 23 vehicles falling, 48 deaths, and 30 injuries. This study used Small Baseline Subset InterferometricSynthetic Aperture Radar(SBAS-InSAR) technology, combined with Sentinel-1A radar remote sensing imagery, to map the spatiotemporal distribution of surface displacement on the Meida Expressway slope. By integrating satellite remote sensing imagery, site conditions, rainfall records, and a digital elevation model (DEM), the displacement pattern of the embankment slope was analyzed, and the causal mechanism of the landslide was revealed. The results show that a slow separation trend between the slope crest and toe had already appeared long before the accident, and this landslide was a retrogressive (pull-type) landslide. Surface displacement was significantly correlated with seasonal rainfall, indicating that abnormally heavy rainfall was likely the main trigger of this landslide. This study verifies the effectiveness of integrated remote sensing technology in monitoring slowly changing retrogressive landslides and provides a potential approach for future landslide hazard monitoring and early warning. Review of the Meida Expressway Landslide The Meida Expressway is a two-way, four-lane expressway connecting Meijiang District of Meizhou City with Dabu County in Guangdong Province, China. The Meida Expressway landslide occurred at 2:10 Beijing time on May 1, 2024. Based on field photographs in Figure 1(a-c), the landslide volume is estimated at approximately 5,215 cubic meters, the collapse depth at the slope crest is about 7.7 meters, and the sliding distance exceeds 100 meters. After the landslide, a void appeared between the embankment and the road surface (Figure 1(c)), ultimately causing a section of pavement 17.9 meters long and 12.25 meters wide to collapse, with an affected pavement area of 184.3 square meters. The event occurred during the peak travel period of the May Day holiday, causing multiple vehicles to plunge into the deep pit formed by the collapse. As of 15:30 on May 2, a total of 23 vehicles were reported to have fallen, causing 48 deaths and 30 injuries. Figure 1 Field photographs of the Meida Expressway landslide: (a) landslide site (2024/05/01/17:27:20); (b) landslide impact area (2024/05/01/17:01:45); (c) damaged pavement area (photos from CCTV and Xinhua News Agency). This study obtained monthly rainfall for the landslide area over the past three years, daily rainfall for the two months before the event, and hourly rainfall for the ten days before the landslide. Figure 2(a) shows that rainfall in the landslide area exhibits seasonal variation, with concentrated and persistent heavy rain during the annual rainy season (April to September), while rainfall is lower in winter (October to December) and spring (January to March). In April 2024, the area experienced unprecedented heavy rainfall (Figure 2(b)), with continuous rainfall lasting 16 days between April 16 and May 1, during which the daily rainfall on April 25 reached as high as 119 mm. The monthly rainfall in April reached 742 mm, 2.8 times the April 2023 rainfall (266 mm). The hourly rainfall data for the ten days before the landslide show four distinct periods of persistent heavy rainfall, with peak hourly rainfall of 17.4 mm, 18 mm, 13 mm, and 14 mm, respectively. These observations indicate that in April, especially in the period immediately preceding the landslide, the landslide area experienced rainfall events of unprecedented frequency and intensity, with a rainfall pattern significantly deviating from the historical norm. Figure 2 Rainfall data for the Meida Expressway landslide. (a) Monthly rainfall and cumulative rainfall from April 2021 to April 2024; (b) daily rainfall and cumulative rainfall from March 1, 2024 to April 30, 2024; (c) hourly rainfall and cumulative rainfall from April 21 to April 30, 2024. Methods and Validation This study adopted SBAS-InSAR technology to analyze the temporal evolution characteristics of surface displacement in the study area based on phase changes in time-series radar imagery, using 32 Sentinel-1A ascending-orbit radar images spanning April 12, 2023 to April 30, 2024. The surface displacement retrieved by InSAR represents displacement along the radar line-of-sight (LOS) direction, which is the composite result of three components: vertical, east-west, and north-south. Based on the surface-parallel flow hypothesis, this study decomposed the LOSdisplacementinto horizontal and vertical displacements according to the slope-satellite geometric relationship (as shown in Equations (1-3)). where ULOS,USlope,UV,UH represent the LOS, slope aspect, vertical, and horizontal displacements; θ, ε, α, and β represent the radar incidence angle, satellite azimuth angle, slope aspect angle, and slope gradient. Figure 3 Schematic diagram of the slope-satellite geometric relationship. Given the lack of reliable field monitoring data in the Meida Expressway landslide area, this study validated the effectiveness of SBAS-InSAR technology by comparing with GNSS monitoring data from theTanglang Mountainslope in Shenzhen, Guangdong Province, China. A GNSS-based real-time monitoring system was deployed on the Tanglang Mountain slope in May 2021 (Figure 4(a)). Figure 4(b) shows a comparison between the InSAR inversion results at the GNSS monitoring station location and the GNSS monitoring data. The vertical cumulative displacements obtained by InSAR and GNSS exhibit a consistent trend, with a maximum numerical difference of 1.5 mm, which is mainly due to differences in measurement accuracy between the two methods and decorrelation effects. In summary, the InSAR inversion results can reliably reflect the relative displacement pattern of the landslide mass, with an average relative error of 0.11. Figure 4 Comparison of SBAS-InSAR and GNSS results for the Tanglang Mountain slope. (a) Vertical cumulative displacement of the Tanglang Mountain slope based on SBAS-InSAR; (b) comparison of vertical cumulative displacement between GNSS and InSAR. Slope Surface Displacement Pattern SBAS-InSAR technology was used to obtain the cumulative displacement along the LOS direction in the Meida Expressway landslide area from April 12, 2023 to April 30, 2024. Subsequently, based on Equations (1-3), the cumulative LOS displacement was projected and decomposed into vertical and horizontal displacements. The vertical displacement is positive upward, and the horizontal displacement is positive toward the slope surface; the cumulative displacement maps are shown in Figure 5. Using the road area as a stable reference datum, the displacement error in this area was calculated to follow anormal distributionwith an error range of 0.03 ± 1.64 mm, indicating high confidence in the inversion results. As shown in Figure 5(a), the vertical cumulative displacement map clearly shows significant downward cumulative displacement in the landslide area. Areas adjacent to the landslide zone also exhibit relatively small downward cumulative displacement (shown as orange dots), and the downward cumulative displacement gradually decreases with distance from the landslide area (shown as green and light blue dots). The distribution pattern of horizontal cumulative displacement is consistent with that of vertical cumulative displacement. In magnitude, horizontal displacement is generally greater than vertical displacement, which is attributed to the geometric relationship between the slope and the satellite during projection. Compared with the vertical displacement map, the horizontal displacement map reveals an interconnected displacement zone between the landslide area and a pre-existing high-displacement area (Figure 5(b)). The presence of a continuous displacement zone below the landslide area indicates that significant horizontal displacement already existed in this area before failure. After the landslide, the impact of the sliding mass may have triggered movement in this area, thereby forming an S-shaped impact zone (see Figure 3). To more clearly illustrate the spatial characteristics, Figure 5(c) further compares the cumulative displacements of Area I and four points within the landslide mass on March 25 and April 30, 2024. It can be clearly observed that the closer a point is to the slope toe, the greater its cumulative displacement, indicating a "separation trend" between the slope crest and toe. Comparing the results of the two dates, this separation trend became more pronounced after persistent heavy rainfall, indicating an accelerated displacement rate at the slope toe. With continued rainfall, it can be inferred that the cumulative displacement and displacement rate at the slope toe continued to increase, the separation trend became increasingly evident, and the sliding surface gradually developed from the toe toward the crest, ultimately triggering the landslide. Figure 5 Spatial distribution of cumulative displacement. (a) Vertical cumulative displacement map of the calculation area from April 12, 2023 to April 30, 2024; (b) horizontal cumulative displacement map of the calculation area from April 12, 2023 to April 30, 2024; (c) cumulative displacement of Area I and various points within the landslide area on March 25, 2024 and April 30, 2024. To further reveal the temporal characteristics of landslide movement, this study further analyzed the vertical cumulative displacement time series of Area I and four points within the landslide mass and compared them with rainfall data, as shown in Figure 6. The rainfall data for the landslide area cover the period from April 1, 2023 to April 30, 2024, with each data point representing the cumulative rainfall over 12 days within that period. The cumulative displacements of Area I and the four points can be divided into five stages: (1) Stage 1 (April 12 to July 17, 2023): During this period, the cumulative displacements of all four points in the landslide area showed an increasing trend, with a maximum displacement of 10 mm, possibly influenced by two rounds of rainfall. (2) Stage 2 (July 17 to September 27, 2023): Rainfall data show a period of heavy rainfall between August and September. However, because shotcrete and anchor support was implemented on the slope during this period, the time-series displacement did not show a significant downward trend. (3) Stage 3 (September 27, 2023 to February 6, 2024): Due to sparse rainfall during this period, the points in the landslide area did not show a significant movement trend. (4) Stage 4 (February 6 to March 13, 2024): Compared with the previous stage, rainfall increased slightly, and the cumulative displacements of the points within the landslide mass showed a slight downward trend. (5) Stage 5 (March 13, 2024 to just before the landslide): During this period, rainfall gradually increased, the points in the landslide area showed a more pronounced downward trend, and a significant separation trend appeared between the slope crest and toe. Before the landslide, the maximum displacement of Point 4 near the slope toe reached 21 mm, while the cumulative displacement of Point 1 near the slope crest was 11 mm, clearly indicating separation between the toe and crest. At this time, the pavement displacement was almost 0 mm, indicating a tendency for the pavement to separate from the expressway embankment slope. Figure 6(a) clearly shows a positive correlation between the displacement patterns of the four points within the landslide mass and rainfall intensity. The average displacement rates and average rainfall amounts for the four stages in Figure 6(a) were calculated, and their correlation is shown in Figure 6(b). The results indicate that increasing rainfall intensity systematically increased the displacement rate of the landslide mass, and this phenomenon was particularly significant in the area near the slope toe. For example, in the critical Stage 5, the average daily rainfall reached 17 mm/day. During this period, the average displacement rate of Point 4 near the slope toe was -0.22 mm/day, while that of Point 1 near the slope crest was lower, at -0.13 mm/day. The significant difference in displacement rates among these points led to progressive separation of the slope. Figure 6 Time-series cumulative displacement within and above the landslide mass and its correlation with rainfall. (a) Time-series displacement of Area I and Points 1-4; (b) correlation between the average displacement rates of Points 1-4 and average daily rainfall. Landslide Mechanism Analysis The foregoing analysis shows that the temporal variation of surface displacement in the landslide area is closely related to seasonal rainfall, and rainfall intensity is positively correlated with landslide displacement rate; it is therefore inferred that rainfall is the main driving factor of this landslide. Combining the DEM and Google Earth optical imagery, a catchment area exists at an elevation of 70 meters below the landslide area (Figure 7). This catchment area has a collecting basin developed in three directions—west, north, and east—and its extent gradually expands from the bottom upward. The landslide area is located within this collecting basin, with a slope of about 15°, which means that the landslide area lies on the catchment path of this basin, indicating that under rainfall conditions, rainwater will continuously infiltrate the embankment slope and converge along the slope surface toward the catchment area. Because the strongly weathered or completely weathered granite covering this area softens easily upon contact with water and has high permeability, such seasonal surface runoff and internal seepage likely caused the loss of soil particles at the slope toe, increasing the likelihood of landslide occurrence. In addition, as rainfall intensity increased, more water flowed over the slope surface or infiltrated the soil under the effect of topographic convergence, reducing soil strength and enabling the soil to slide at a faster rate, further increasing the likelihood of slope instability. This round of heavy rainfall, far exceeding historical levels, greatly intensified this effect and ultimately triggered the landslide. Figure 7 Contour map of the study area In addition, according to the aforementioned spatial distribution characteristics of displacement, the significant separation trend between the slope toe and crest indicates that the Meida Expressway landslide belongs to the retrogressive landslide mode. According to previous studies, the retrogressive landslide mode forms because external factors cause the loss of support at the slope toe, after which the entire slope gradually slides along the sliding surface under the action of gravity. As shown in Figure 8, a retrogressive landslide has three main characteristics: (1) The initial initiation point of a retrogressive landslide is usually located at the slope toe. (2) The instability process begins at the landslide toe and gradually propagates upward to the crest. When the instability reaches the crest, tension cracks form at the crest. (3) A retrogressive landslide usually manifests as a slow, progressive failure process rather than a sudden large-scale slide. This progressive failure process allows the landslide to evolve over a long period and may include multiple sliding stages. From Figure 5(c) and Figure 6, it can be seen that the slope toe has the largest cumulative displacement and displacement rate, indicating that this landslide started at the toe and gradually developed upward, which is highly consistent with the characteristics of a retrogressive landslide. Figure 8 Schematic diagram of a retrogressive landslide Conclusions Taking the Meida Expressway landslide event as a typical case, this study used SBAS-InSAR technology, Sentinel-1A radar satellite data, rainfall data, site conditions, and DEM data to analyze the spatiotemporal evolution trend of surface displacement on the Meida Expressway slope, the correlation between displacement and rainfall, the landslide mechanism, and its potential triggering factors, and drew the following conclusions: (1) The surface displacement in the Meida Expressway landslide area exhibits a clear separation trend. From 2023 to 2024, the displacement difference between the slope crest and toe gradually increased by 10 mm. This slowly developing separation trend between the crest and toe had already existed long before the accident and ultimately led to a bottom-up retrogressive failure mode. (2) The surface displacement pattern of the Meida Expressway slope shows a significant correlation with seasonal rainfall. Based on an integrated analysis of the topographic, hydrological, and meteorological conditions of the adjacent area, it is inferred that abnormally heavy rainfall was the main triggering factor of the Meida Expressway landslide. (3) This study verified the effectiveness of InSAR technology for monitoring retrogressive landslides with long-term separation displacement trends significantly correlated with seasonal rainfall, and it can serve as an effective means for their early warning. In the future, remote sensing methods should be combined with low-altitude UAVs, video surveillance, or in-situ sensor monitoring to build a multi-level monitoring network with higher accuracy and better efficiency.



Industry Award | Associate Professor Cao Bin Honored with the 27th "Mao Yisheng Beijing Youth Science and Technology Award"
下一篇Leizhou City's 11,500-Mu High-Standard Farmland Construction Project Passes Completion Acceptance

2026-10-14 0 0

2026-09-28 36 0

2026-09-22 10749 0

2026-09-18 11026 0

Lize City Air Terminal Underground Main Structure Nearing Completion: Maximum Transfer Walk Under 4 Minutes After Operation

Anti-seepage Curtain for Main Lock Pit of CSCEC Port Shenqiu Double-Line Lock Project Completed on Schedule

All Pile Foundations Completed on Quanzhou Baiqi Channel
Hainan Upgrades Housing and Municipal Infrastructure

First Foundation Concrete Pour Successfully Completed for Zambia Kafue West–Muzuma 330kV Transmission Line EPC Project
Hot News

评论 (0)